Samantha Liu: Agora Verkehrswende
Samantha Liu: Agora Verkehrswende

The Vehicle Emissions Calculator was actually proposed by one of my supervisor’s coworkers, Günter Hörmandinger. He wanted to create such a calculator because Agora Verkehrswende needed a way to quantitatively understand the implications of a policy regulation proposal. This calculator will essentially predict how the fleet, thus the carbon emissions, will change over time. Günter noted that they could hire outside consulting firms to calculate this for them, but they take too long and charge too much money. So, there is a significant value in creating an in-house calculator that can rapidly calculate the rough magnitude of emissions emitted and analyze certain trends of regulatory scenarios when compared against a business-as-usual scenario. Therefore, the challenge was to structure the calculator in a way that allows the user to simulate the conditions and constraints of a proposal quickly and easily.
In the first week, I read prior literature to better understand the existing vehicle stock forecasting models as well as the political landscape of integrating electric vehicles into the market. Afterwards, I had a better idea of what kind of datasets we needed for the model. So, I spent the next week gathering datasets that helped us better understand the current vehicle stock broken down by age and fuel type, the rate of survival for each fuel type by age, the starting mileage of each fuel type, the mileage degradation rate of each fuel type by age, and the average CO2 emissions of each fuel type. The three main data sources we ultimately used in our model are the following: Kraftfahrt-Bundesamt (KBA), Transport Emission Model (TREMOD), and European Environmental Agency (EEA). From there, we started building the model in Excel. We chose to build the model in Excel rather than a programming language such as Python because it’s easier for someone not technically data savvy to understand what is happening at each step of the model.
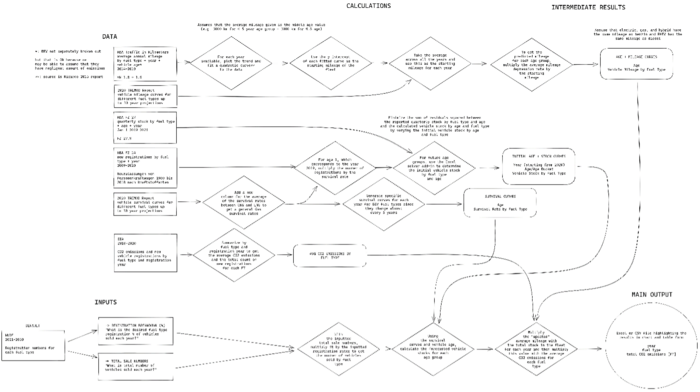
At a high level, the model takes in a table of vehicle registration rates by fuel type and total vehicle sales numbers per year as inputs, creates an intermediate table by running some calculations with these inputs and data from our three main data sources, and produces a summarized table of CO2 emissions per year by fuel type for the next 30 years as an output. We will refer to the intermediate table as Age + Stock + Emission Curves. Starting with the inputs, the user can specify the vehicle registration rates and the sales numbers per year for each fuel type. The Age + Stock + Emission Curves gives the predicted vehicle stock and emissions by vehicle age and fuel type for a given year. It makes these predictions based on data from our three main data sources. KBA provides mileage and registration data on the current vehicle fleet, TREMOD provides survival rates of each fuel type as vehicles age, and EEA provides CO2 emissions for each fuel type. The model distinguishes the following vehicle fuel type classifications: Petroleum, Diesel, Liquefied Petroleum Gas, Compressed Natural Gas, Electric, and Hybrid. Each year has 155 entries, one entry for every vehicle age from 0 to 30 for each fuel type. For each entry, the initial vehicle stock is multiplied by the appropriate survival rate depending on the age of the fleet by year of entry to get the projected remaining vehicle stock for that year. Then, this value is multiplied by the appropriate mileage to get the approximate number of kilometers traveled by the fleet. Finally, this value is multiplied by the appropriate average CO2 emissions and divided it by 1012 to calculate the approximate CO2 emissions emitted by the fleet in mega-tonnes. For the final output, the Age + Stock + Emissions Curves are grouped by year and fuel type and sums up the CO2 emissions. This table can then be used to produce simple bar charts to visualize the trend of CO2 emissions by fuel type and determine whether Germany will reach zero emissions by 2050.
Once we had this model set up, we were able to plug in three hypothetical extreme scenarios and three more realistic scenarios inspired by existing reports and public claims. For instance, the European Union’s Fit for 55 plan mentions that by year 2035 only electric vehicles will be sold to the public. The calculator would then take this constraint into consideration and bring the registration rates of petroleum and diesel vehicles down to 0% and bring the registration rates of electric vehicles up to 100%.
Working for Agora Verkehrswende was definitely an interesting and unique experience. First, let’s address the obvious. The pandemic altered my personal GRIP experience by forcing my supervisor and me to find virtual alternatives to typical in-office collaboration and communication methods. Because of the situation, I was unable to travel to Germany to work at Agora Verkehrswende in-person. So, my supervisor, Maita Schade, and I would meet one to two times a week over the Zoom or Microsoft Teams platform. She was based in Berlin, which means we needed to schedule meetings whenever the nine-hour time difference overlapped. Early into the internship, we agreed we would take turns meeting at 8:00 AM CEST and 8:00 AM PST. That way we both take turns waking up early. There were pros and cons to having this time difference. On one hand, we were able to seamlessly answer each other’s questions and transition work off to each other. As I sent my updates and questions for the day, Maita will review my work thus far, answer my questions, and add some comments for me to address as soon as I wake up. However, on the other hand, sometimes I made assumptions to prevent stalling my work and it turns out that I did the work incorrectly and need to redo the work. The other challenge was explaining theoretical concepts without visuals. This admittedly created a lot of miscommunications and frustrations on both ends. Fortunately, I found a platform called “Excalidraw”. With Excalidraw, I was able to clearly denote my current understanding of the calculator’s workflow and she was able to collaborate with me in real-time. A sample flowchart after one of our work sessions can be seen above.

Another challenge the pandemic presented was the typical internet issues. There were days where my internet bandwidth was not strong enough and our conversations became choppy. When this happened, we would turn off our videos, and, if that didn’t work, we resorted to typing out our responses. The situation clearly wasn’t ideal for efficient communication, but I believe we did a great job communicating issues and working through them together to find solutions that accommodated both of us.
Everyone at Agora Verkehrswende was super supportive of me and my work and accommodating with my language barriers. In fact, the CEO, Christian Hochfield, requested everyone to speak English during their all-hands weekly group meetings so I could understand. I was pleasantly surprised at how receptive people were to this request. Almost everyone privately apologized to me for their poor English, to which I responded with, “Don’t worry, my German is way worse than your English”. As a side tangent, I took a German language class (GERLANG 2) at Stanford while working for Agora Verkehrswende. At the beginning of each meeting, there was always small talk which gave me the opportunity to practice my German. At the end of my internship, I also presented on my work and everyone seemed engaged in the content. I even got challenging questions during the Q&A portion of the presentation and messages after the presentation thanking me for my work.
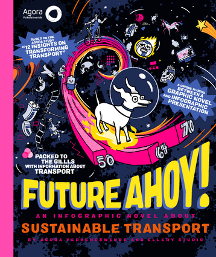
I forgot to take photos/screenshots during my internship, but below are some photos of some German gifts they sent me! Maita sent me typical German snacks such as Kugeln, licorice drops, and the infamous Haribo gummy bears. She also sent me some Agora specific souvenirs such as an Agora Verkerswende labeled coffee mug and an English version of their recently published infographic novel (photo of cover above).

Overall, my time at Agora Verkehrswende was such an enjoyable and rewarding experience. I was able to not only feel the meaningfulness and see the impact of my work, but also meet and work with such an amazing group of individuals who are passionate about the same thing as me – sustainable, convenient, affordable, and accessible transportation solutions that make our world a bit more bearable to live in.
Back to Intern and Researcher Profiles
Back to the Graduate Research and Internship Program in Germany
